Course evaluation
Section 5 (1) of the Lower Saxony Higher Education Act (in German: Niedersächsisches Hochschulgesetz, NHG) stipulates that "the quality of courses must be evaluated by students at least once a year". At Osnabrück University, students have been regularly evaluating courses since 2006. For this purpose, the Teaching Evaluation Service Office was set up, which is located at the Institute of Psychology but organizes the questionnaire-based course evaluation for the entire Osnabrück University as a central institution. Details are set out in the regulations for conducting student course evaluations.
The "philosophy" of course evaluation at Osnabrück University is that the process itself is primarily controlled by the individual lecturer and is part of staff development.
Contact us
FAQ
Details are set out in the regulations for the implementation of student course evaluations at Osnabrück University. Usually each department will be evaluated every three semesters.
For the regular evaluations, a rotation scheme (see below) was defined by the Central Commission for Studies and Teaching on 25/04/2006, according to which two to three departments are designated for evaluation each semester. This grouping of departments was chosen so that the evaluations reach approximately the same number of students. Due to the merger of the School of Cultural Studies and Geography (FB1 "Social Sciences" and FB2 "Cultural Studies and Geography") to FB1 "Cultural Studies and Social Sciences", the rotation scheme was slightly changed as of 01/04/2015.
Teachers in the departments included in the rotation scheme will be informed about the evaluation by the Teaching Evaluation Service Center by email at the beginning of the relevant semester.
Rotation scheme:
| Group | Semester | Department |
| 2 | Summer semester 2026 | FB05 School of Biology/Chemistry FB06 School of Mathematics/Computer Science/Physics FB07 School of Language and Literary Studies |
| 3 | Winter semester 2026/27 | FB03 School of Educational and Cultural Studies FB08 School of Human Sciences |
| 1 | Summer semester 2028 | FB01 School of Cultural Studies and Social Sciences FB09 School of Business Administration and Economics FB10 School of Law |
Lecturers obliged to evaluate in the summer semester 2026 (PDF, 501 kB)
You are welcome to register your courses for evaluation irrespective of the rotation scheme.
You can register directly here.
It is ultimately possible to evaluate a course at any time. Even during the semester break, registrations for evaluation are processed and reports are sent out.
Many lecturers get their courses evaluated at the end of the semester in order to get an overall impression of the whole of the course. However, you can also obtain feedback in the middle of the semester so that you can make changes to the course if necessary.
If you would like to have your course evaluated toward the end of the course, we recommend that you register and ask for evaluations in good time, no later than the penultimate session. This gives you the opportunity to discuss the results with the students and enter into a dialog with them. In this way, students can see that you take their ratings seriously and are often willing to provide additional meaningful feedback.
The "philosophy" of course evaluation at Osnabrück University is that the process itself is primarily controlled by the individual lecturer and is part of staff development. This also means that you as a lecturer always initiate the evaluation process yourself by registering, even in semesters in which you are obligated to have your teaching evaluated as a member of a department according to the rotation scheme.
You can register the evaluation of your courses directly here on the pages of the Teaching Evaluation Service Center. To ensure that the survey documents can be sent to you in time, your registration should be received at least seven days before the survey date you have set.
All standard questionnaires for evaluating face-to-face events are available in a paper-based and an online version, you are ultimately free to choose the type of evaluation. However, online evaluations save resources (especially paper) and offer higher data quality, not least because the typical inaccuracies of paper-based surveys (e.g. the use of unsuitable pens, the ambiguous placement of crosses, illegible handwriting, etc. are avoided).
Originally, paper-based questionnaires were predominantly used for evaluations, as the response rate for paper-based evaluations in presence was better than for online surveys, which often took place outside of course times. There is a not insignificant risk here of falling short of the minimum number of responses required to produce an evaluation report. This criterion rarely causes problems with paper surveys if care is taken to choose a suitable evaluation date (e.g. not in the week before the Christmas vacations, not in the last week of the semester, not shortly before another exam, etc.) and there were enough participants at the beginning of the semester.
However, it is now very easy to answer the evaluation questionnaires on a mobile device and thus also to conduct an online evaluation in person. And herein lies the crucial point for a good student participation rate: face-to-face evaluation during a course session. Since the coronavirus pandemic, the ratio of paper-based and online evaluations has almost reversed and online questionnaires are now the norm.
During the digital semesters, we have developed variants of our standard questionnaires specifically for digital or hybrid courses. These can only be administered as online evaluations. You can find more information on the differences and similarities of all questionnaire variants
here; you can also view all variants in the Download area.
There is also now the option of inviting students to evaluate courses online using a non-personalized QR code or a link. Alternatively, you can choose the option of personalized TANs, which had to be distributed to students in advance by lecturers (e.g. by serial mail or by handing out physical TAN cards during the course). The advantage of this more time-consuming procedure is that students cannot evaluate your course more than once. You can currently choose between the two options on our registration page.
In addition to the simpler distribution, access via link or QR code offers the possibility of having your course evaluated online during a face-to-face session. This can be done by presenting the QR code via the projector (e.g. in your presentation slides) or embedding it in other materials that you would like to use during the session (e.g. printing the QR code on assignment sheets, inserting the "clickable" link into a PDF script).
Here you will find a detailed description of the possibilities of an online evaluation (PDF, 533 kB).
You can currently choose between six questionnaire versions for each of your events. These questionnaires can be used in face-to-face events either on paper or online. In addition to the English version, there is also an German version of each questionnaire.
Five of the questionnaire versions have been developed for prototypical event types: Each of the five questionnaire variants contains statements on the general subject areas (PD, IR, US, see next question) and additionally sets priorities adapted to the event type (e.g. the seminar questionnaire FESEM contains questions on presentations given, cf. fig.). There is no obligation to use the instrument that corresponds to a course’s type. For example, there are lectures that are very interactive and could also be evaluated well with the FESEM instead of the lecture-specific FEVOR. Similarly, there are seminars that contain a large proportion of practical exercises and no presentations and could therefore perhaps be evaluated just as well with the FEUEB or FEPRA. Here, the decision aid (PDF, 65 kB) provides information on the specific focus of the individual questionnaires.
A questionnaire enables an assessment of competence acquisition (FEKOM) regardless of the type of course. Students can use this questionnaire to assess their subjective skills acquisition from the course they have attended on four different dimensions (e.g. professional competence, methodological competence, etc.).
For purely digital or hybrid courses, with the exception of FEPRA, there is also a questionnaire variant (e.g. FEVORhd) that also covers aspects of hybrid and digital learning (e.g. digital implementation of the course, self-study). You can find an overview here.
If you are not sure which questionnaire is the most suitable for your type of course, take a look at the sample copies (see below) and/or the decision aid (see above). Check which questions can probably be answered by most students and choose "your" evaluation questionnaire on this basis. In addition, you can point out to students that they should leave answer fields blank or tick "not applicable" if the relevant questions do not fit the course.
In the questionnaires, students' impressions and assessments of various topics are collected. All six double-sided questionnaires contain a series of statements at the beginning, such as: "The way in which the course is held furthers understanding of the subject". Students can indicate the extent to which they agree or disagree with each of these statements on a five-point response scale. The scale ranges from "strongly disagree" (1) and "somewhat disagree" (2) to "somewhat agree" (3), "somewhat agree" (4) and "strongly agree" (5). The answer option "not applicable" is also available.
In terms of content, these statements can be grouped into overarching topics (dimensions) that cover central aspects of good teaching. The number of statements assigned to a topic area varies between the questionnaire types.
In five of the six standard questionnaires (FEVOR, FESEM, FEUEB, FEPRA, FESPR), the statements on the first page relate to specific aspects of the course and cover the following three subject areas:
- Planning and presentation (in German: Planung und Darstellung, PD)
- Interestingness and relevance (in German: Interessantheit und Relevanz, IR)
- Dealing with students (in German: Umgang mit Studierenden, US)
The questionnaire for evaluating students' skills acquisition (FEKOM) is an exception in terms of the subject areas or dimensions covered. Four areas of competence are mapped here:
- Professional competence (in German: Fachkompetenz, FA)
- Self-competence (in German: Selbstkompetenz, SE)
- Methodological competence (in German: Methodenkompetenz, ME)
- Social competence (in German: Sozialkompetenz, SO)
Each questionnaire type is followed by a series of global individual questions, which can be used to give ratings in the form of school grades (from 1 = very good to 5 = poor) and which relate to the "course lecturer" and the "course as a whole" as well as in some cases to other questionnaire-specific areas (e.g. in the competence-related questionnaire, rating one’s own participation). In the competence-based FEKOM questionnaire, respondents are also asked to agree or disagree with statements regarding their overall satisfaction with the above-mentioned subject areas (PD, IR, US, and SU) and to rate their general satisfaction with the support.
In addition to the statements on the various subject and competence areas and the global individual questions, the questionnaires also ask a number of specific questions relating to the general conditions and student characteristics (e.g. gender, prior interest in the course, reasons for attending the course). The questionnaires conclude with an open question in which the students can make further comments and suggestions in free form.
Of course, it is not possible to address all relevant aspects of a course in the questionnaire since it should be kept quite short. However, empirical studies and theoretical considerations confirm that the questionnaires used here cover all important aspects well.
Sample questionnaires can be found under in the Downloads section or in the FAQ above. Further information on the questionnaire instruments used can be found in the following publications:
- Staufenbiel, T. (2000). Fragebogen zur Evaluation von universitären Lehrveranstaltungen durch Studierende und Lehrende. Diagnostica, 46, 169-181.
- Staufenbiel, T. (2001). Universitätsweite Evaluation von Lehrveranstaltungen in Marburg: Vorgehen, Instrumente, Ergebnisse. In E. Keiner (Hrsg.), Evaluation (in) der Erziehungswissenschaft (S. 43- 61). Weinheim: Beltz Verlag.
- They can each apply for their own evaluation. In this case, the other lecturer registers their own evaluation using the registration form. In this case, the participants fill out one questionnaire per lecturer.
If you have any questions, please contact us by phone or email.
If you would like to get a course evaluated that has several groups (e.g. several exercise groups), you have various options:
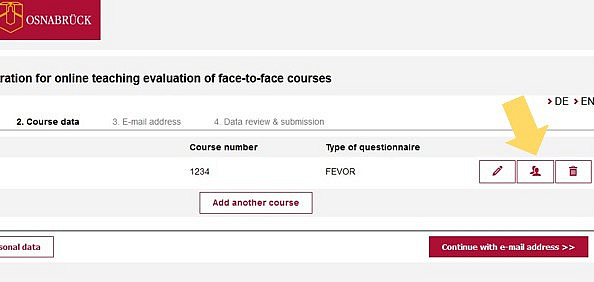
- You can apply for a separate evaluation for each group. To do this, please add each group as a separate course under point 2 in the registration form. Please number the groups consecutively for differentiation or give them abbreviations (in the title).
- You can evaluate all groups together. In this case, add only one course under point 2 in the registration form and select the number of questionnaires or TANs according to the total number of participants. Subsequent separate evaluation of the groups is then only possible after timely consultation with the Teaching Evaluation Service Center!
Yes, you can. There is an English version of all standard questionnaires (FEVOR, FESEM, FEUEB, FEPRA, FEKOM, and FESPR) and their variants for digital or hybrid courses.
The online evaluation offers students the choice of language via a flag symbol. they can simply click the English flag and the questionnaire appears in English.
In the paper-based evaluation, it is possible to use German and English questionnaires at the same time or to use only English-language questionnaires. To do this, please enter the desired number of German questionnaires and English questionnaires in the respective language in the registration form.
- If possible, evaluate in presence during the session to increase the response rate.
- Allocate a total of approx. 10 to 15 minutes in a session (answering takes approx. 5 to 10 minutes).
- Depending on the type of access selected:
- Present link/QR code at the end of the session (e.g. slides).
- or distribute TAN slips (send by serial e-mail if necessary).
- If necessary, announce link and QR code in Stud.IP for students who are not present.
- Notes to students:
- Answer unsuitable questions with "not applicable".
- If important questions are missing, have them answered in the free text field.
- Data protection/anonymity: Due to the encrypted transmission of data, no conclusions can be drawn about individuals.
- Communicate the final date of the evaluation.
- The report will be sent on the next working day after the final date of the evaluation (only to the lecturer).
- You are encouraged to present results to students and discuss with them.
- Evaluate in presence during the session to increase the response rate.
- Allocate a total of approx. 10 to 15 minutes in a session (answering takes approx. 5 to 10 minutes).
- Distribute the questionnaires.
- Do not use photocopied questionnairesas these cannot be scanned!
- Information for students:
- Important: Follow the instructions for completing the questionnaire (see the inside of the attached leaflet).
- answer inappropriate questions with "not applicable".
- If important questions are missing, have them answered in the free text field.
- Data protection/anonymity: only use block capitalisation in the free text field so that your handwriting cannot be matched to you.
- Fill out the leaflet and put it in the return envelope.
- Collection of the questionnaires by students.
- Place answered and blank questionnaires in the return envelope and seal it.
- Return the envelope to the Teaching Evaluation Centre immediately so that the report can be prepared. This ensures that you can discuss about it with students before the end of the course.
- The report will be sent within a few working days (only to lecturer).
- You are encouraged to present the results to the students and discuss them with them.
If fewer than six students take part in the evaluation of a course, no results report will be issued. There are a variety of reasons for limiting the data evaluation to a minimum number of six questionnaires: Firstly, the reliability of the averaged feedback decreases. This means that the validity and informative value of the results cannot be guaranteed. Secondly, with a very small number of participants, the anonymity of the feedback is jeopardized. The individual responses, particularly those to the open question at the end of the questionnaire, can easily be traced if the number of completed data sets is low.
Even a course with more than six participants can slip below the minimum response number. You can try to counteract this by increasing the response rate.
Increasing the response rate is particularly useful if the number of participants is only just above the minimum limit for the evaluation. There are two possibilities:
- If the questionnaires are completed during a course meeting (either online via QR code/link or paper-based), the response rate is noticeably higher.
- Experience has shown that the number of students present decreases towards the end of the lecture period. You can therefore reach more students by bringing the evaluation date forward and thus increase the response rate.
Can I get the questionnaires back if no report could be produced?
In the case of a paper-based evaluation, it may be possible to deduce from a questionnaire who completed it (e.g. on the basis of handwriting). In order to guarantee anonymity, completed questionnaires must be collected and bagged by students. Returning the questionnaires would run counter to this measure and is therefore not possible.
Yes, this is possible. Please note that students must be willing to complete the questionnaire several times. This willingness will be supported if you clearly communicate your desire for concise feedback to reflect on the course concept and your own teaching behavior and then discuss the evaluation results with the students.
If you would like to evaluate a course at several points in the semester, please fill in a separate line for each desired evaluation time under point 2 in the registration form and add a suffix to the title of the course (e.g. "Eval. 1", "Eval. 2" or similar).
All results reports will be sent to the person-specific e-mail address specified in the registration form.
In the case of an online evaluation, you will receive the results report on the next working day after the evaluation deadline you set in the registration form. If the minimum number of six participants has not been reached, you will be informed by us. You can then extend the evaluation and set a new end date. To do this, you can simply reply to our information e-mail; you do not need to register a new evaluation.
In the case of a paper-based evaluation, the process takes a little longer. After completing the questionnaires during the course, they are sent by internal mail to the Teaching Evaluation Service Center using the enclosed return envelope. There, the questionnaires are first checked by our student assistant. Sometimes students use unsuitable pen colors that offer too little contrast when scanning the sheets, or the sheets are so damaged that they cannot be scanned but must first be copied. Once the sheets have been scanned and the contents analyzed, the report will be sent directly to the person-specific e-mail address specified in the registration form. You should allow up to five working days for the whole process. If you want to discuss the results with the students at the end of the course, you should therefore carry out the evaluation in the preceding session at the latest.
The standard report on course evaluation contains a comparison with percentile norms in addition to the responses averaged over the students ("raw scores"): The "Global values" section, the first section of the feedback report, provides an overview of the evaluation results in specific subject areas addressed. These are set in relation to the results achieved on average in lectures evaluated at Osnabrück University.
What are Percentile Rank norms?
A "Percentile Rank" indicates how many lecturers (as a percentage) in the comparison sample achieved the same or a worse result. The higher the percentile rank, the better the students rate the corresponding dimension of the course.
Presentation of results in the report
The name of the lecturer, the title of the course and the number of students who took part in the evaluation ("Questionnaires completed") are listed in the report header.
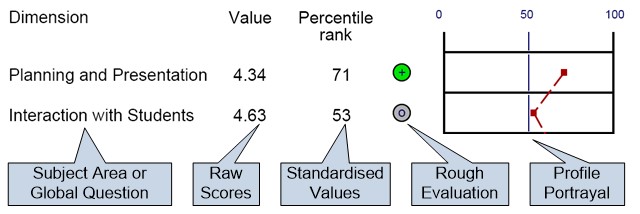
The first section of the results report, Global values, contains the results relating to the three above-mentioned subject areas and the three individual global questions. The aspect reported in each case can be seen in the column headed "Dimension". The column labeled "Raw score" provides the answers averaged across all students (who answered the relevant questions). The raw scores ...
- range between 5.0 (=best possible score) and 1.0 (=worst possible score) for the subject areas (e.g. “Planning and presentation”, “Dealing with students” and “Interestingness and relevance”) and the question on subjective learning success . Here, all students and all relevant questions are averaged.
- range between 1.0 (=best possible value) and 5.0 (=worst possible value) for school grades.
All the information to the right of the raw scores helps you to classify these results. For example, is a raw score of 4.34 in the subject area "Planning and presentation" to be considered as good? Of course, various evaluation criteria are possible here. For example, the result could be considered a success if a lower raw score of 4.05, for example, was achieved in the last evaluation of the same course. A comparison could also be made with parallel courses, if available. The evaluation assistance provided in this report is based on a comparison with a large number of lectures that have already been evaluated using this questionnaire.
The column labeled "Percentile Rank" indicates how many lecturers in the comparison sample (as a percentage) achieved the same or a worse result. The higher the percentage rank, the better the students' assessment of the course. To calculate the norms the mean values of the courses in the standard sample were used (and not those of the individual questionnaires), which were evaluated using the respective questionnaire (e.g. FEVOR).
On the far right, the profile display provides a graphical illustration of the percentile ranks (see figure).
For example, a percentile rank of 71 means that of all the courses evaluated to date in Osnabrück using the questionnaire, 71 % were rated just as good or worse by the students
(and correspondingly 29 % better).
Between the indication of the percentile rank and the profile line is a column with colored symbols that enables a rough assessment of the percentile ranks.
The second section provides a detailed presentation of the answers to all individual questions. For each question, the number of students who answered the question (n), mean values (in German: Mittelwert, mw), standard deviations (in German: Standardabweichung, s) and abstentions (in German: Enthaltung, E) are reported here.
In the third section of the report, all student comments on the final question about possible comments and suggestions for the course (open question) are presented. If no one has answered this question, the corresponding page is missing from the feedback report.
Here you will find a sample report for viewing as well as information on calculating the percentile norms.
Why do we provide percentile norms instead of standard norms?
The reason is that standard values can only be interpreted correctly if the data on which the calculation is based is normally distributed. However, analyses have shown that for some questionnaire variants this requirement is not met for some dimensions. The reason for this is that, on average, there are more good than bad ratings. This can lead to an incorrect interpretation of the result for the dimensions concerned. Percentile rank values do not require normally distributed data and lead to a correct evaluation in such cases.
Percentile rank values cannot be converted into standard values, nor can they be compared with them. As the percentile rank values are able to differentiate significantly more in the middle range than the standard norm values, this tends to result in broader profile lines. For the evaluation with plus and minus symbols, the categories were selected in such a way that they come as close as possible to the original ones. If the normal distribution assumption were not violated, the plus/minus ratings would be comparable.
| Symbol | PR norm | Standard norm |
| Double minus (--) | <= 5 % | <= 7 % |
| Minus (-) | <= 35 % | <= 31 % |
| Neutral (0) | <= 65 % | <=69 % |
| Plus (+) | <= 95 % | <= 93 % |
| Double plus (++) | > 95 % | > 94 % |
When registering the evaluation, you can specify whether you would also like a report without the comparison with percentile norms. This report will then be created additionally; the percentile norm report is standard and is always created. The only exception to this is currently (still) the evaluations of digital or hybrid events. The data basis for these questionnaires is not yet sufficient to be able to calculate norms.
As a few technical adjustments to the evaluation software are required to send reports without norm values (e.g. replacement of report templates) and these adjustments can lead to errors during ongoing operations, reports without norm values are generally only sent to lecturers in two waves:
- at the beginning of the semester break and
- at the end of the semester break after the end of the course period.
If you urgently need reports without norm values at a different time, for example as part of an application procedure, please contact us so that we can provide you with this report at short notice.
If you have any questions about the results report, you are welcome to contact the staff at the Teaching Evaluation Service Center directly.
We also have information on some typical questions for you here:
An average of 2 is good! Why is it still classified as (below) average?
Raw and standard scores can be assessed in different ways. For example, is a raw score of 3.8 (on a scale of 1.0 to 5.0) in the subject area "Planning and presentation" to be considered as good? In this case, the result could be considered a success if a lower raw score of e.g. 3.1 was achieved in the last evaluation of the same course. If available, a comparison with parallel courses could also be made. The evaluation assistance provided in the results report is based on a comparison with a large number of courses that have already been evaluated using these questionnaires. As can be seen from the norm values, many courses have received good to very good ratings, which is why it is possible that a good result is classified as (below) average. You can get an overview of the current standard values here.
No presentations were given in my seminar. Why do I still get check marks for these questions?
It is possible that students have inadvertently answered the question about presentations. As it is not possible for us to consider which check marks were made on purpose and which were made by mistake, we cannot do anything about this problem. Another cause of error may be that a student has crossed out the question in a paper-based evaluation. As our software cannot differentiate between check marks and cross-outs, values may also have been read for this reason. It therefore makes sense to point out to students that they should leave the fields blank or mark "not applicable" and not cross them out if the corresponding questions do not fit the course.
To counteract this problem, a global value is only calculated if each question has been answered by at least 20 % of the students. This setting does not apply to the mean values in the "evaluation section of the closed questions"; these are therefore also calculated if the completion rate is less than 20 %.
Presentations were given in my seminar. Why don't I get a score for these questions?
A global value is only calculated if each question was answered by at least 20% of the students. We had this feature implemented in the evaluation software in order to counteract the problem that a few (erroneous) answers lead to the calculation of global values. However, this can lead to no global value being calculated in a seminar with presentations because too few students have given an answer. In this case, you can refer to the mean values in the "evaluation section of the closed questions" which are nevertheless given.
What are percentile ranks?
A "percentile rank" indicates how many lecturers (as a percentage) in the comparison sample achieved the same or a worse result. The higher the percentage rank, the better the students rate the corresponding dimension of the course. Further information can be found here.
Why are percentile norms calculated and not standard norms?
The reason is that standard values can only be interpreted correctly if the data on which the calculation is based is normally distributed. However, analyses have shown that for some questionnaire variants this requirement is not met for some dimensions. The reason for this is that, on average, there are more good than bad ratings. This can lead to an incorrect interpretation of the result for the dimensions concerned. Percentile rank values do not require normally distributed data and lead to a correct evaluation in such cases.
The results report will only be sent to the lecturer named on the registration form. Only personal e-mail addresses are used, which are usually provided at the time of registration. In rare cases, a secretarial email or an "info@..." may be provided by the lecturer. In this case, we first try to determine the personal e-mail address, as otherwise it cannot be ensured that no one other than the lecturer can view the report.
If other lecturers are specified when registering, they will also receive the results report at their personal email address.
The data from the returned paper forms are stored as anonymized data records in a database to which only the employees of the Teaching Evaluation Service Center have access. The same applies to the data from the online evaluations, which are also stored in this database.
Only the respective lecturers themselves receive a written report on the evaluation of their course, in which the most important analyses are compiled.
For the teaching units scheduled for evaluation in the rotation scheme, the following also applies: In the middle of the semester, the respective dean of studies receives an overview of which persons in the teaching unit are participating in the evaluation and which are not, in order to be able to remind them specifically of the evaluation participation. In addition, the deans of studies receive a written report with aggregated data (no individual results) and an overview of who did and did not participate at the end of the semester. Evaluations from at least three lecturers must be available for the dean of studies report so that no conclusions can be drawn about the results of individual lecturers. Otherwise, no dean of studies report will be created for data protection reasons.
The paper forms are kept sealed until the end of the following semester and are then destroyed.
As a supplementary (qualitative) evaluation option, virtUOS offers lecturers the opportunity to carry out a so-called TAP (Teaching Analysis Poll) in the middle of the semester as part of the university didactic offerings. Further information, including how to register, can be found here.
Overview literature
-
Rindermann, H. (2001). Lehrevaluation. Einführung und Überblick zu Forschung und Praxis der Lehrveranstaltungsevaluation an Hochschulen mit einem Beitrag zur Evaluation computerbasierten Unterrichts. Landau: Verlag Empirische Pädagogik.
- Spiel, Ch. (2001). Evaluation universitärer Lehre - zwischen Qualitätsmanagement und Selbstzweck. Münster u. A.: Waxmann.
Questionnaire instruments
-
Staufenbiel, T. (2000). Fragebogen zur Evaluation von universitären Lehrveranstaltungen durch Studierende und Lehrende. Diagnostica, 46, 169-181.
-
Staufenbiel, T. (2001). Universitätsweite Evaluation von Lehrveranstaltungen in Marburg: Vorgehen, Instrumente, Ergebnisse. In E. Keiner (Hrsg.), Evaluation (in) der Erziehungswissenschaft (S. 43-61). Weinheim: Beltz Verlag.
Bias variables
-
Beran, T. & Violato, C. (2005). Ratings of university teacher instruction: how much do student and course characteristics really matter? Assessment and Evaluation in Higher Education, 30(6), 593-601.
-
Brockx, B., Spooren, P. & Mortelmons, D. (2011). Taking the grading leniency to the edge. The influence of student, teacher and course characteristics on student evaluations of teaching in higher education. Educational Assessment, Evaluation and Accountability, 23, 289-306.
-
El Hage, N. (1996). Lehrevaluation und studentische Veranstaltungskritik. Projekte, Instrumente und Grundlagen. Bonn: Bundesministerium für Bildung, Wissenschaft, Forschung und Technologie.
-
Staufenbiel, T., Seppelfricke, T. & Rickers, J. (2015). Prädiktoren studentischer Lehrveranstaltungsevaluationen. Diagnostica. Advance online publication. doi: 10.1026/0012-1924/a000142